veilles / 30 Mar 2012
A look at the nation's changing viewing habits from TV Licensing

Truly madly deeply in love with television: nation spends more than two months a year in front of screens
New report reveals trend of “chatterboxing” amongst Britons, as one in four (26%) opts for two-screen viewing.
Not only does the average Brit spend over two months a year watching television, social media sites are also influencing the viewing choices of many people, according to a report published by TV Licensing today.
Research conducted for TeleScope 2012, which looks at the UK’s TV viewing habits, suggests that the trend of commenting via a second screen about a programme, or ‘chatterboxing’, is starting to grip the nation. A quarter of all adults (26%), and just under half (44%) of those aged under 35, say they have commented to others, online or via SMS, about a TV programme they have been watching.
Chatterboxing* is actually reinforcing some people’s desire to watch scheduled TV. An ICM poll suggests that a quarter (24%) of social media savvy adults**, aged under 35, watch a programme live, rather than on catch up, because they enjoy being part of the related social media chatter. One in five (19%) are more likely to watch something as it is being shown on TV because they are worried ‘social media spoilers’ will ruin the ending.
Online buzz is further changing viewing behaviour by introducing us to new programmes, as one in six (17%) of those aged under 35 who use social media said they can be persuaded to watch a new TV programme if they see online chatter about it.
TeleScope also reveals the average Brit’s weekly TV diet: we consume 28 hours*** of TV, which includes 2.5 hours*** of catch-up, on the ‘traditional’ TV set. We top this up even further because, on average, we estimate we spend over three hours** per week tuning into the small(er) screen, watching programmes on our laptops, smartphones and tablets, according to ICM research commissioned by TV Licensing. In total, this could amount to watching over 31 hours per week, or more than two months per year.
The report highlights broader changes to the nation’s viewing habits, as our love affair with TV evolves in response to recent innovations in technology:
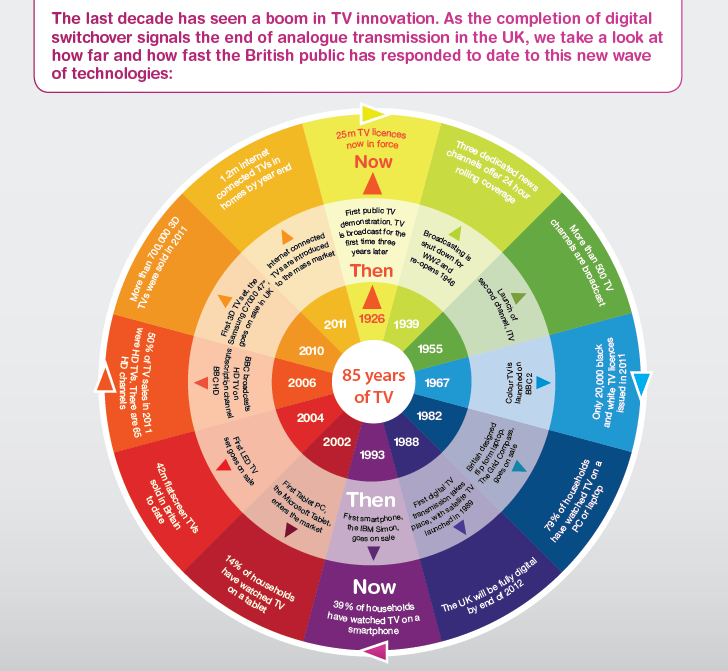
We have a myriad of TV devices: The average household has 2.3 TV sets, 1.51 laptops, 0.77 smartphones and 0.33 tablets on which we watch television.
Brits love upgrading: 37% of Brits said they would be investing in additional viewing technology in 2012.
Watching ‘on the go’ is increasing: One in four people (25%) watched TV content on the move in 2011, via mobile viewing technologies. The figure is much higher for under 35s, as 35% watched in this way last year.
We watch in a variety of ways: For this summer’s Olympics, 88% of us are planning to watch the action on the traditional set. We are supplementing our viewing with mobile devices – 7% will watch some of the sporting events on a PC or laptop, and 1% will tune in on a smartphone and 1% on a tablet.
Catch-up viewing is rising: While live TV is still hugely dominant, more people are creating their own TV schedules, as time-shifted viewing accounted for 9.2% of UK consumption in 2011, up from 7.1% in 2010.
TV socialites: TV programmes bring people together physically, as well as virtually. A third of adults, aged under 35, have been to a TV-themed party in the last five years. X-Factor, World Cup 2010, Royal Wedding and Eurovision parties have proved to be among the most popular themes.

